

Our tool offers the possibility to create and view diagrams of tickets and chats by yourself.
There are two different places to do this:
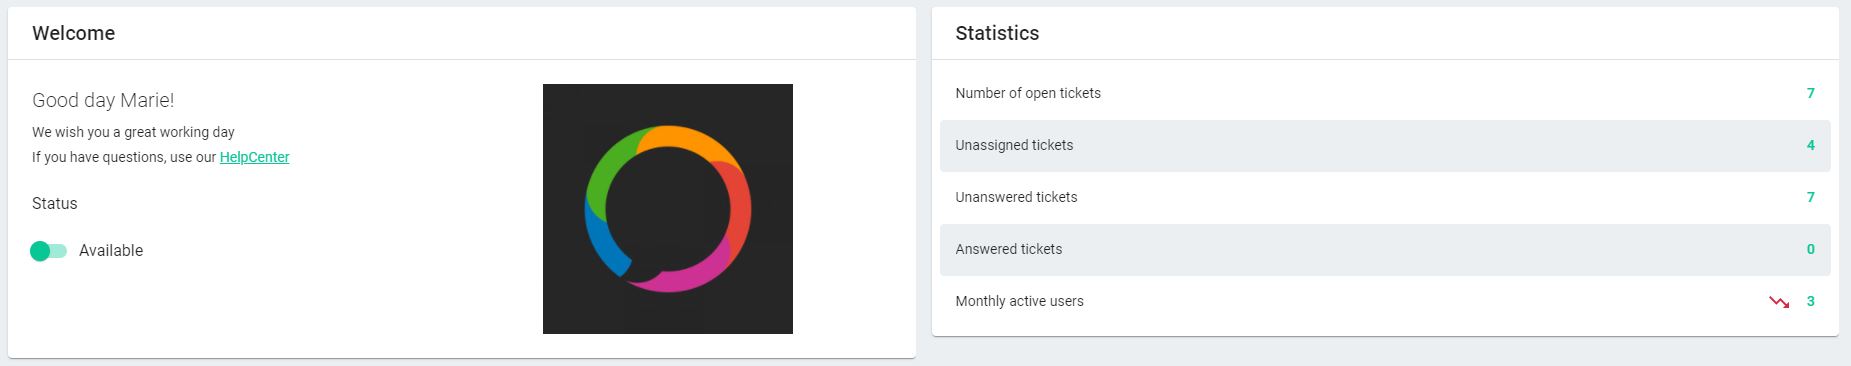
- After you have logged in to the tool, current ticket statistics, e.g. the number of open and answered tickets, are displayed in the dashboard on the right.
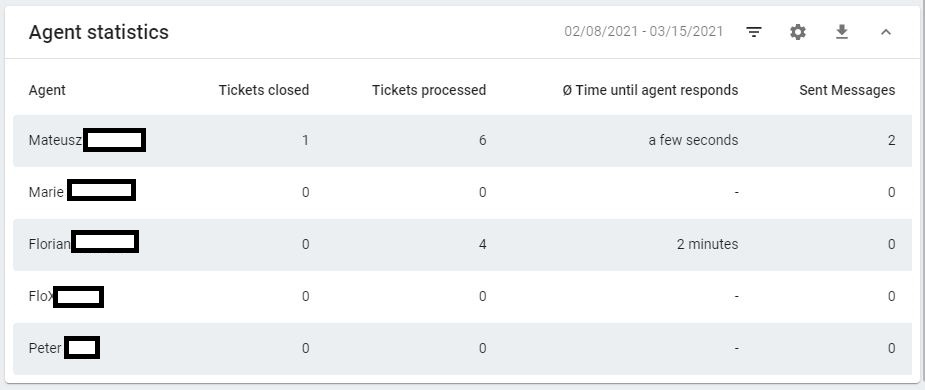
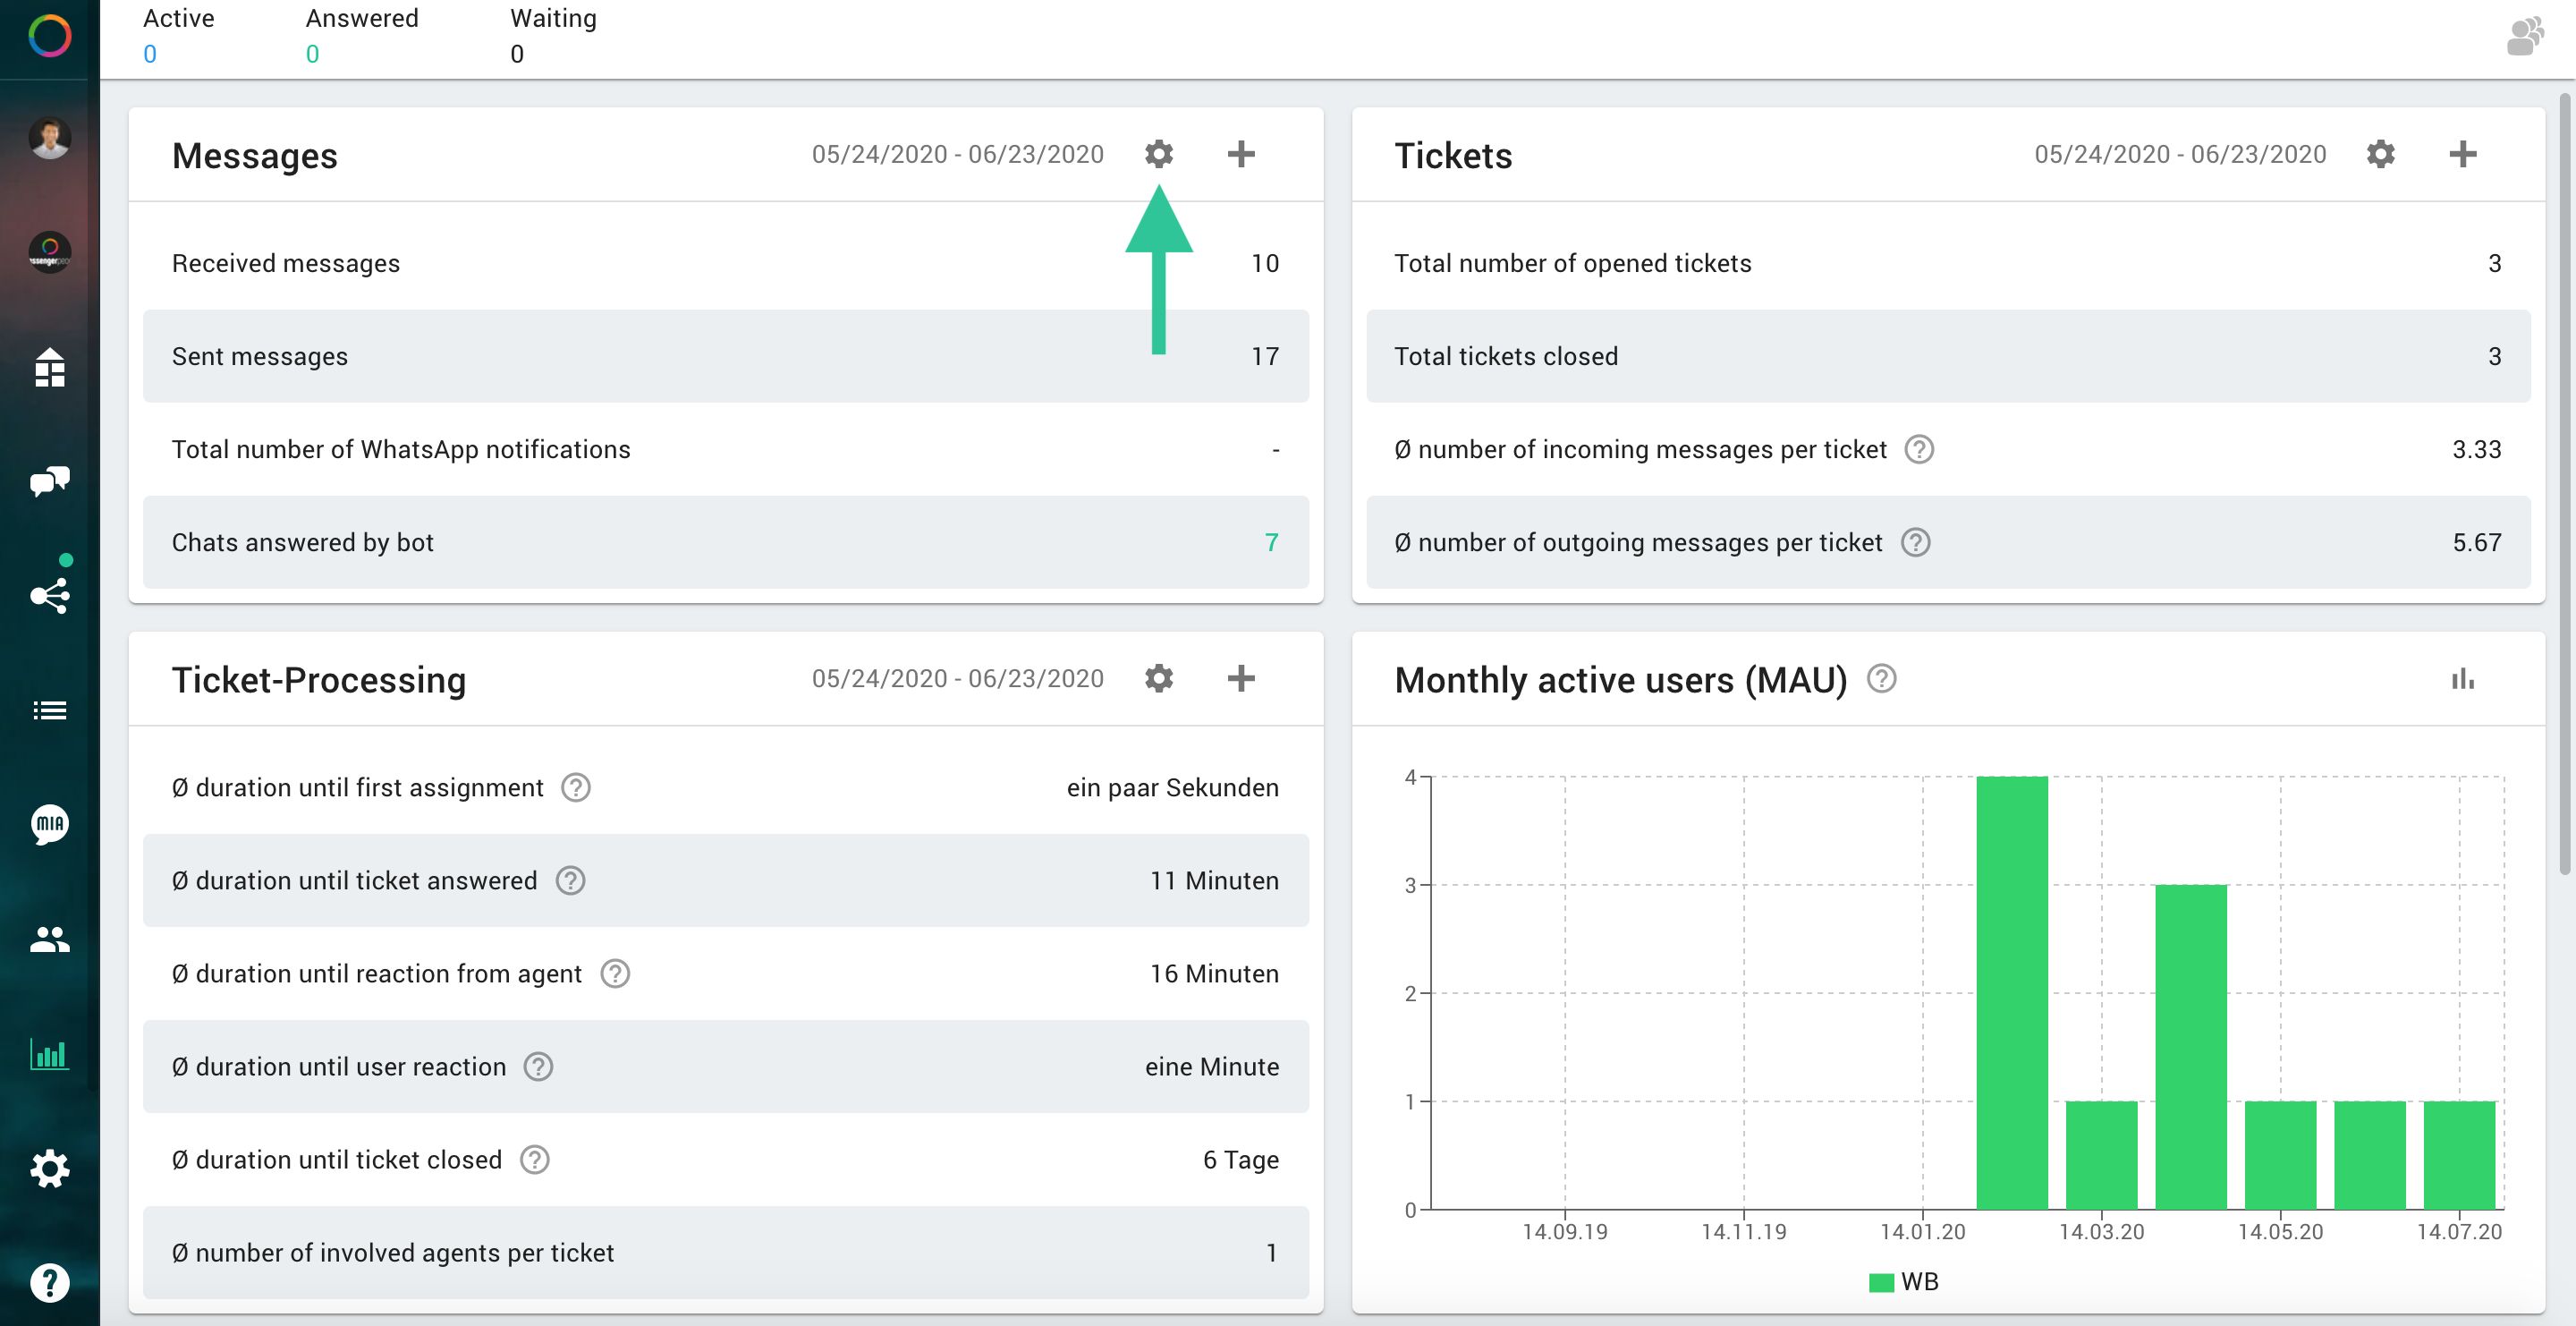
- Under the menu item “Statistics” you will find predefined statistics: Messages, Ticket, Ticket Processing and Monthly Active Users (MAU). On request, our support team can also activate an additional panel “Agent Statistics” here. Here, already known KPIs like “solved tickets”, “tickets processed”, “average time until agent answers” and “sent messages” are broken down to the individual agents, so that a good evaluation is possible. To activate the panel, simply write a short e-mail to support@messengerpeople.com.

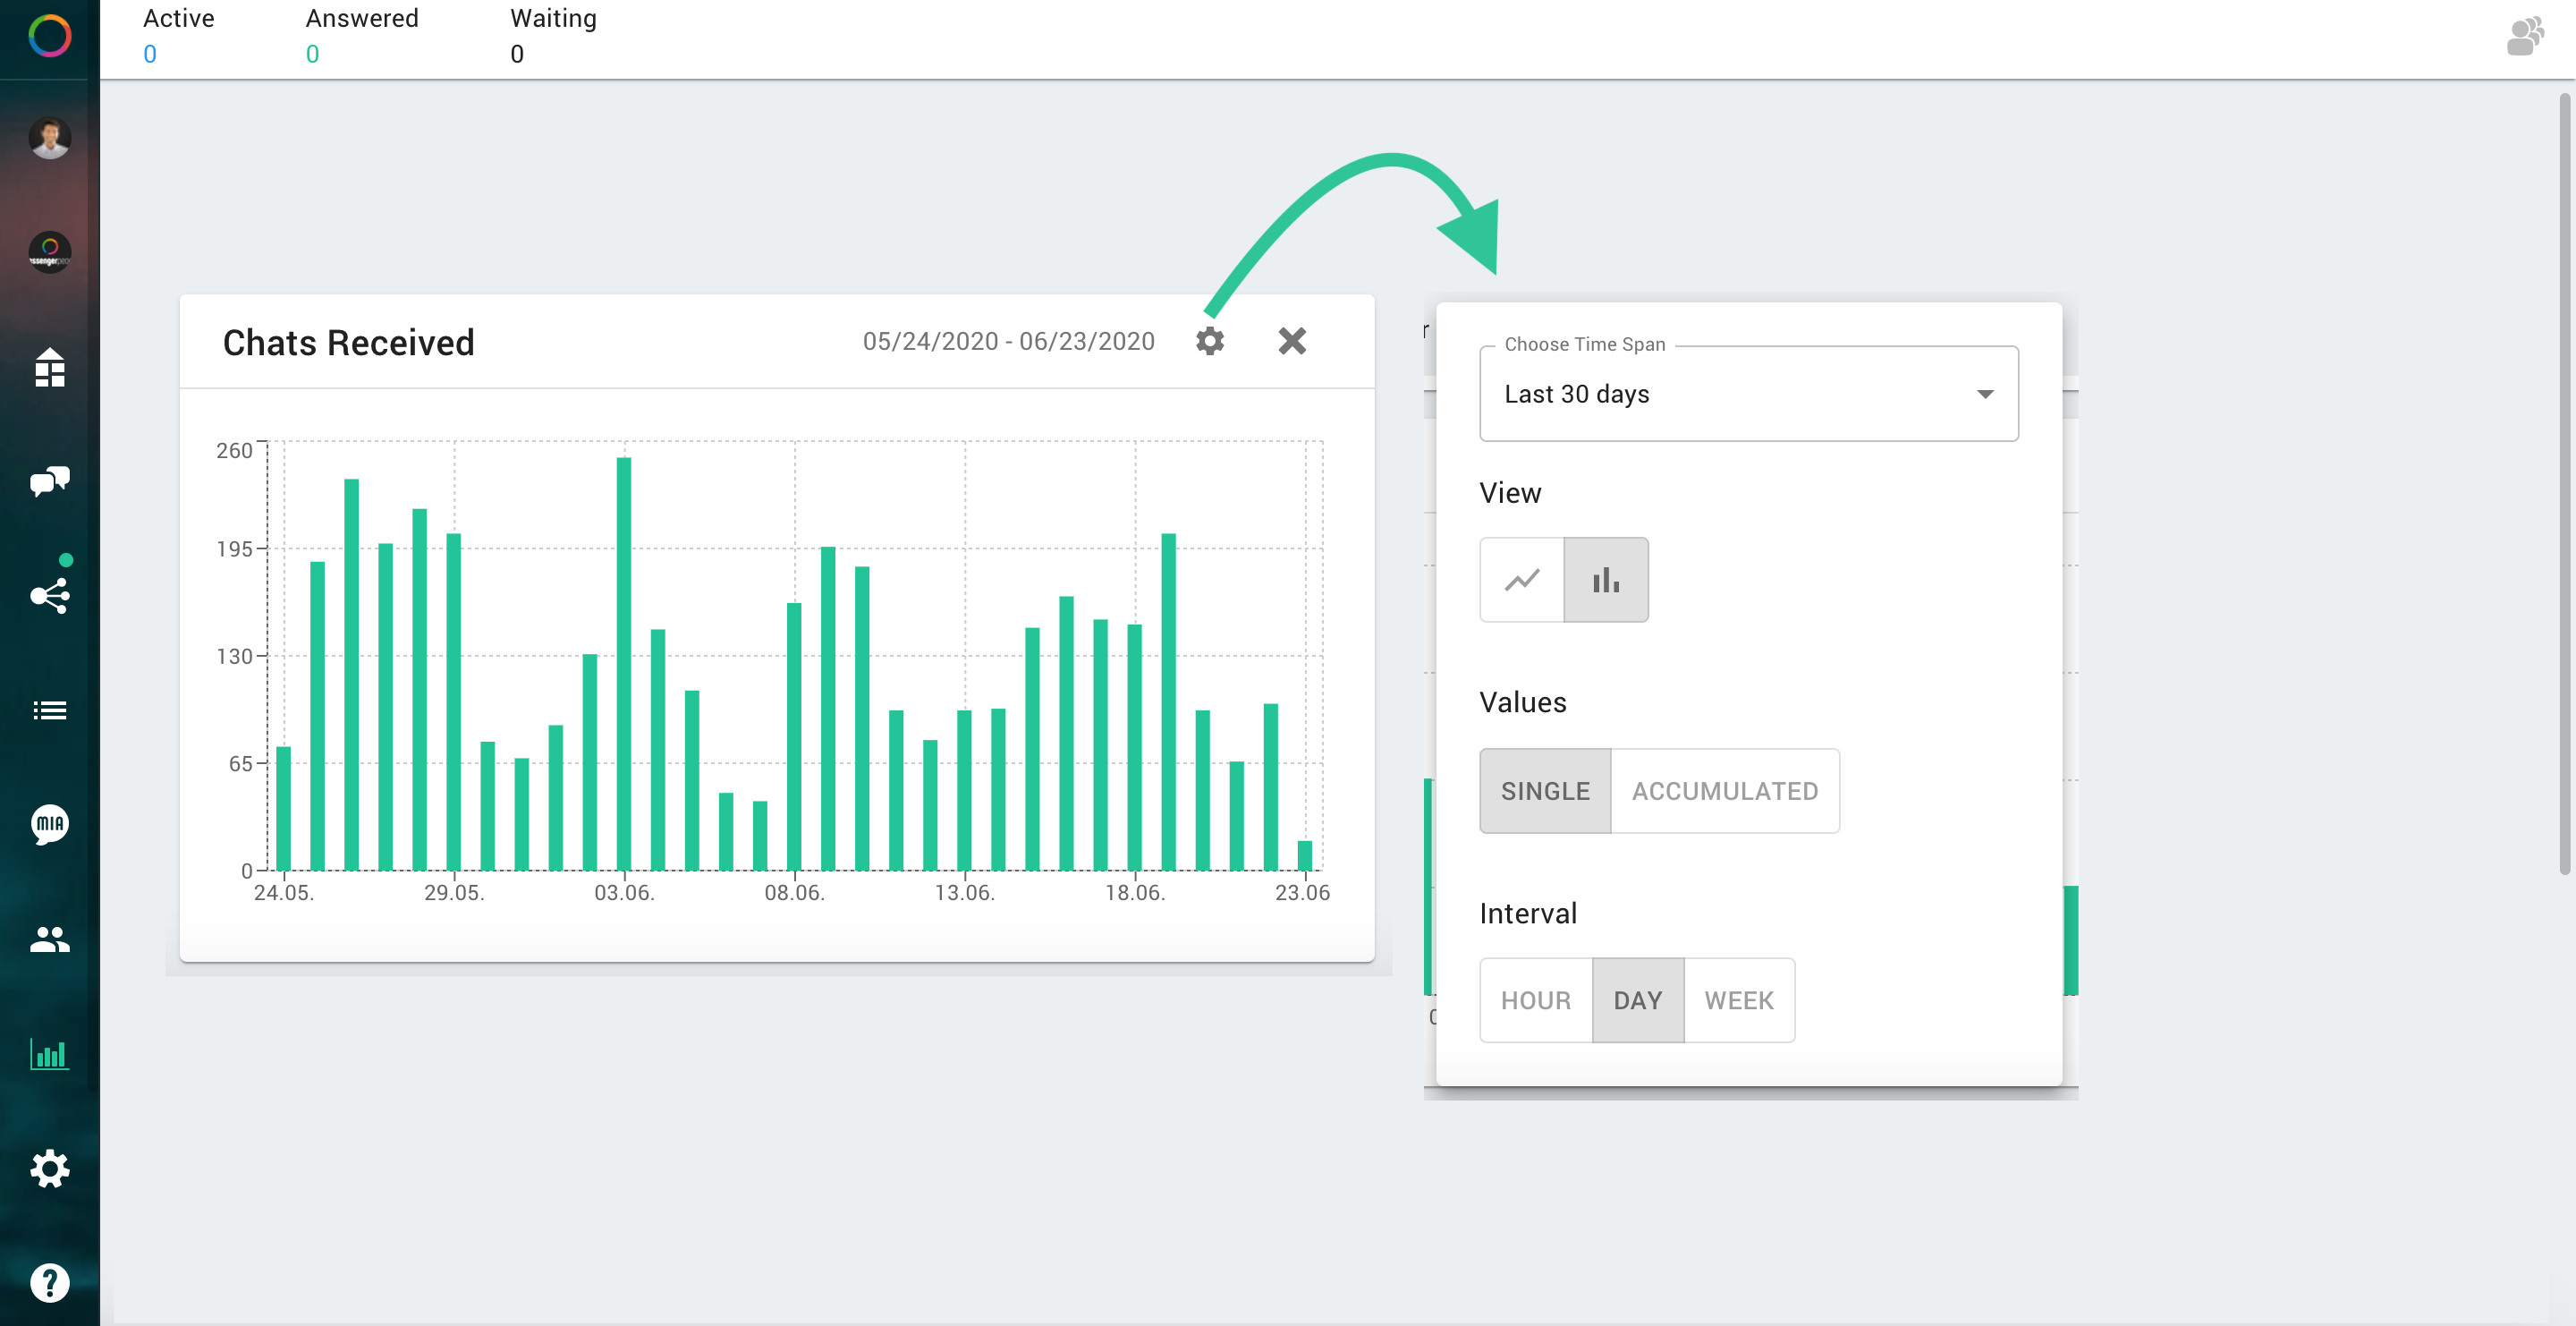
You can open a pop-up and change the time period by clicking on the gear symbol in the panel. If you click to the right you can filter for agents. On the far right you can show or hide the panel.


Afterwards you can create individual charts for “Chats” and “Tickets”.
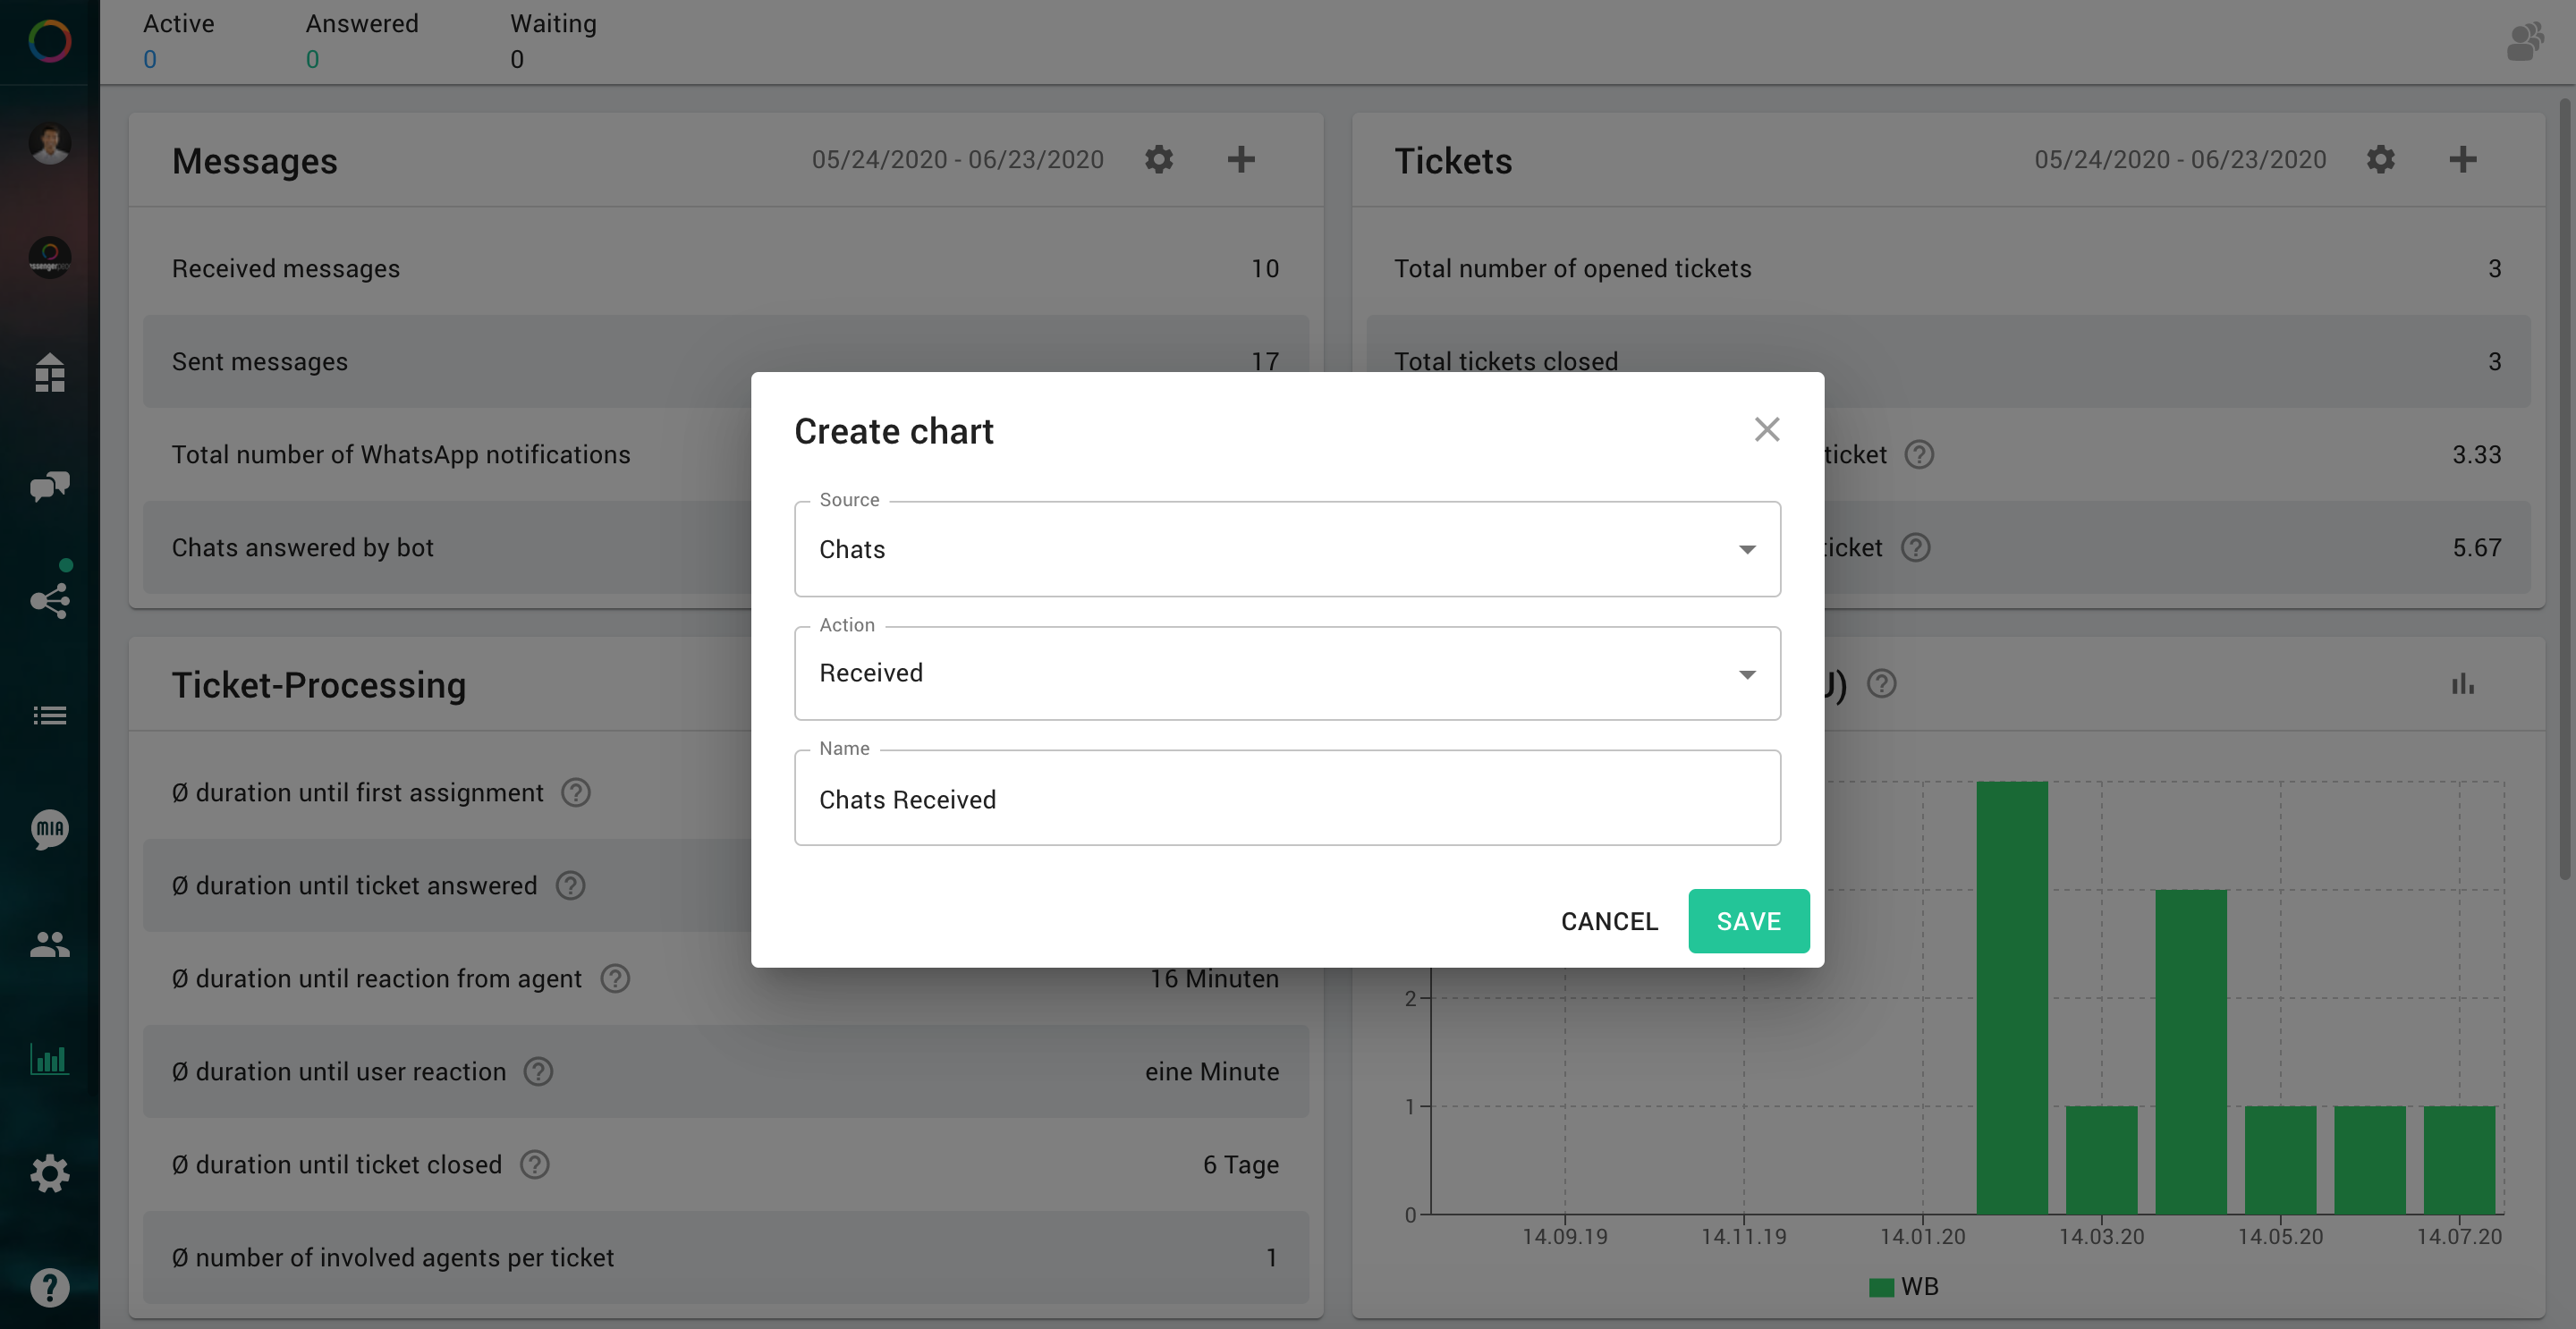

For the chat diagram
you can choose between “Received | Sent” for Action.
When selecting “Sent” you can also define the sender: “All | Agents | Bot“.
For the ticket diagram
you can choose between: “Opened tickets | Solved tickets | Average time to ticket answered | Average time to ticket solved“.
To save a diagram, you must enter a name and then click on Save.
You can open a pop-up via the gear symbol in each diagram panel and define further criteria. For example, you can choose the time period and the view between a line or a bar chart. You can also display the values individually or accumulated. Also the time interval can be selected as: hour, day or week.

Special feature: If you move the mouse over the graphic, you can view the chat statistics at individual times.
Statistics are visible for agents with the role administrator and dispatcher.
Notification statistics
If you use WhatsApp notifications, you will also see statistics. You can view, download or hide / minimize them as usual for a certain period of time.
Automation statistics
In the statistics there is a new panel that highlights the benefits of (partial) automations. You can see at a glance how chatbots, chatblocks and other mechanics increase the efficiency of customer support.
The following KPIs are provided:
- Percentage of tickets in which a chatbot was used.
- Percentage of tickets in which a chatblock was used.
- Percentage of tickets assigned automatically.
- Percentage of tickets with automated (outbound) messages.
- Time saved by autorouting.
- Time saved by chatblocks.
- Time saved by automatically sent messages.
For the time saving we need a comparison, where we assume the following default values: - Autorouting: 30 seconds
- Chatblocks: 90 seconds
- Automated message: 15 seconds
The assumed default value can be overwritten by our support if you want to calculate the KPIs based on other assumptions.
Chatblock statistics
If you use chat modules, you will also see statistics for them. You can view, download or hide/minimize them as usual for a certain period of time. In these statistics you can see how often the chat module has been sent, how often an answer came within 24h and how the response rate is.
Note: The function is only available since August 2021 – from this date on the numbers will also be tracked.
Explanation: MAU
MAU are Monthly Active Users who received a message from your company via Messenger or sent a message to you in the previous billing month.
Here you also have the possibility to create and display other charts yourself. You can create a new chart by clicking on the “Plus” symbol.